Association of Anxiety with Uncinate Fasciculus Lesion Burden in Multiple Sclerosis
Project Lead
Erica B. Baller
Senior Faculty Advisors
Theodore D. Satterthwaite and Russell T. Shinohara
Brief Project Description:
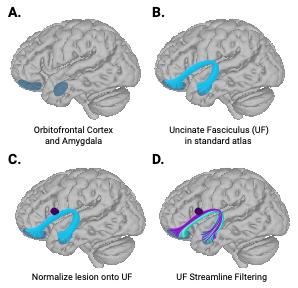
373 participants with MS were included(MS+noA=99; MS+mildA=249; MS+severeA=24). Lesions from research-grade clinical scans were segmented with MIMoSA and normalized to the HCP template. Streamline filtering was performed in DSI studio to generate measures of the degree of fascicle impact by lesions. Disease burden between MS+noA and MS+severeA in uncinate were compared, as well as parametric load of anxiety burden (also referred to as anxiety dose or anxiety severity) with uncinate burden.
Analytic Replicator:
Audrey Luo
Authors/Collaborators:
Erica B. Baller, M.D., M.S., Audrey Luo, B.A., Matthew K. Schindler, M.D., Ph.D., Elena C. Cooper, B.A., Margaret K. Pecsok, A.B., Matthew C. Cieslak, Ph.D., Melissa L. Martin, M.S., Amit Bar-Or, M.D., Ameena Elahi, B.A., Clyde E. Markowitz, M.D., Christopher M. Perrone M.D., Victoria Rautman, B.A., Donovan Reid, Bailey Spangler, B.A., Theodore D. Satterthwaite, M.D., M.A.^, Russell T. Shinohara, Ph.D.^ ^shared last author
Project Start Date:
7/2024
Current Project Status:
Completed
Dataset:
Multiple Sclerosis Cohort (Melissa Martin’s Mimosa (2010-2018), EMR data pull 10/28/2023)
Github repo:
https://github.com/Baller-Lab/msanxiety/
Website
https://Baller-Lab.github.io/msanxiety/
Slack Channel:
#msdepression
Zotero library:
MS Anxiety
Current work products:
ACNP 2024 post abstract - “Anxiety as a disease of white matter disruption: association between anxiety severity and multiple sclerosis lesion burden in the uncinate fasciculus.”
Path to Data on Filesystem PMACS
*** will need to update! All clinical data was drawn from the electronic medical record via the Data Acquisition Center (DAC). All images were obtained from the PACS system from the Department of Radiology.
DAC Pulls (local computer):
 /Users/eballer/BBL/msanxiety/data/dac/investigatingpatientsms2010to2023_full_psych_codes_pt1.csv
 /Users/eballer/BBL/msanxiety/data/dac/investigatingpatientsms2010to2023_full_psych_codes_pt2.csv
 /Users/eballer/BBL/msanxiety/data/dac/investigatingdepressioninmspatients_dates_right_format.csv
MS Proviers (local computer)
/Users/eballer/BBL/general_emr_relevant_spreadsheets//msproviders.csv
Medication information:
ms_medications_brand_and_generic
ICD Codes:
Subject imaging data (cluster):
/project/msanxiety/data/subj_directories
Cubids (cluster):
 /project/msanxiety/cubids/v1_validation.csv
 /project/msanxiety/CuBIDS_outputs/*
MIMoSA QA info (cluster):
/project/msanxiety/data/melissa_martin_files/csv/mimosa_dataframe
Fascicle proportions (for each subject (one row), % of injured fascicle (each column is a fascicle); cluster):
/project/msanxiety/results/fascicle_volumes_all_subjects_roi_n2336.csv
Volume of all lesions (NOT fascicles) for each subject (cluster):
/project/msanxiety/results/mimosa_binary_masks_hcp_space_20211026_n2336_volumes.csv
Volume of each healthy (full volume) fascicle:
/project/msanxiety/templates/dti/HCP_YA1065_tractography/fiber_volume_values.csv
Individual Healthy Fascicle Maps (.nii)
/project/msanxiety/templates/dti/HCP_YA1065_tractography<association,cerebellum,commissural,projection>
Harvard Depression Mask (thresholded 3.09, binarized)
/project/msanxiety/templates/harvard_depression/Dep_clust_T_3_09_binarized.nii
HCP template:
/project/msanxiety/templates/mni_icbm152_t1_tal_nlin_asym_09a.nii
/project/msanxiety/templates/mni_icbm152_t1_tal_nlin_asym_09axbrainmask.nii
CODE DOCUMENTATION
The analytic workflow implemented in this project is described in detail in the following sections. Analysis steps are described in the order they were implemented; the script(s) used for each step are identified and links to the code on github are provided.
* Functions for project *
Sample Construction
We first constructed our sample from n=890 individuals who were diagnosed with multiple sclerosis by a Multiple Sclerosis provider and received their clinical scans at the University of Pennsylvania.
The following code takes the n=825 sample, and goes through a variety of exclusions to get the final n. Specifically, after excluding 11 participants with poor mimosa quality (23) or streamline filtering (55), 814 participants were eligible for anxiety classification. Participants with MS were identified from the electronic medical record and stratified into three age- and sex-matched groups: 1) MS without anxiety (MS+noA); 2) MS with mild anxiety (MS+mildA), 3) MS with severe anxiety (MS+severeA). MS+noA included persons who had no psychiatric diagnosis, took no psychiatric medications, and were asymptomatic on PHQ 2/9 (n = 99, age (SD) = 49.4 (11.7), % female = 75). MS+mildA included persons with either a diagnosis of an anxiety disorder (F40*) or a prescription for an anti-anxiety medication (n = 249, age (SD) = 47.1 (11.1), % female = 82). MS+severeA included persons who had both an anxiety disorder and were taking an anti-anxiety medication (n = 24, age (SD) = 47.0 (12.2), % female = 79).
clean_dac_pull_icd10_codes_and_make_clean_df_post_replication.R
Brain segmentation
To obtain a measure of total brain volume (minus CSF), I used FSL’s fast on all T1w images (post n4 and ws). I then summed the grey matter and white matter volume to create a measure of total brain volume (total_volume).
Wrapper script: get_fast_total_brain_volume_all_subjs.sh
Segmentation script: make_fast_files_single_subj_pmacs.sh
Volume calculation script: make_fast_volume_csv.sh
Automated white matter lesion segmentation
After we obtained our sample, we used the Method for Intermodal Segmentation Analysis (MIMoSA) to extract white matter lesions for each subject. MIMoSA has been previously described:
Valcarcel AM, Linn KA, Vandekar SN, Satterthwaite TD, Muschelli J, Calabresi PA, Pham DL, Martin ML, Shinohara RT. MIMoSA: An Automated Method for Intermodal Segmentation Analysis of Multiple Sclerosis Brain Lesions. J Neuroimaging. 2018 Jul;28(4):389-398. doi: 10.1111/jon.12506. Epub 2018 Mar 8. PMID: 29516669; PMCID: PMC6030441.
Streamline Filtering
Streamline filtering is an interative process performed in DSI studio. HCP template fib file can be found here dsistudio Download: HCP1065 1-mm FIB file. Template is based on HCP 2009a asymmetric.
For each individual, the MIMoSA binary map was considered a region of interest. For the fascicles of interest (uncinate), streamlines that ran through the lesion were “filtered” or kept, whereas the streamlines that avoided the MIMoSA mask were eliminated. Streamlines that passed through the MIMoSA map were then saved binary .nii files, where 1 indicated that disease was present in that voxel, and 0 indicated either 1) that fascicle did not cross through that voxel or 2) there was no disease in it.
I was then able to calculate the proportion of the disease in the uncinate fasciculus (i.e. volume of the streamlines that were affected) by summing the # of 1s in the map, meaning the right and left side, and dividing it by the total volume of streamlines in the canonical UF. At the end, each individual had single values that represented the proportion of lesion burden in the UF.
For more details on streamline filtering, please see https://pennlinc.github.io/msdepression/, published in Baller EB, Sweeney EM, Cieslak M, Robert-Fitzgerald T, Covitz SC, Martin ML, Schindler MK, Bar-Or A, Elahi A, Larsen BS, Manning AR, Markowitz CE, Perrone CM, Rautman V, Seitz MM, Detre JA, Fox MD, Shinohara RT, Satterthwaite TD. Mapping the Relationship of White Matter Lesions to Depression in Multiple Sclerosis. Biol Psychiatry. 2024 Jun 15;95(12):1072-1080. doi: 10.1016/j.biopsych.2023.11.010. Epub 2023 Nov 18. PMID: 37981178; PMCID: PMC11101593.
Final group level analysis
This script is run locally, on R. It does all second level/group data analysis. Main steps summarized below.
MSAnxiety_manuscript_FINAL.Rmd
Disease burden summary measures
I wanted to look specifically at mean disease burden in uncinate fasiculus, given previous literature suggesting that the uncinate is the main white matter bundle connecting mPFC and amygdala, core brain areas associated with anxiety disorders.
Main effect of Diagnosis
A gam with mean_UF_vol as dependent variable, modeling main effect of anxiety diagnosis (MS+noA vs MS+severeA), with sex, total brain volume, and spline of age as covariates.
gam(mean_UF_vol ~ Diagnosis + osex+s(PAT_AGE_AT_EXAM, k = 4, fx = F)+ total_volume, data = uncinate_by_dx_df)
Parametric effect of anxiety “dose”
A gam with mean_UF_vol as dependent variable, modeling main effect of anxiety dose (dose = 0 (MS+nA), 1 (MS+mildA), or 2 (MS+severeA)), with sex and spline of age as covariates.
gam(mean_UF_vol ~ anxiety_dose + osex + s(PAT_AGE_AT_EXAM, k = 4, fx = F)+ total_volume, data=df_demo_and_fascicles_no_unclass_anxiety_dose)
Sensitivity analyses
As a comparison, I also looked specifically at fornix, which is another subcortical fiber connecting prefrontal and medial temporal lobe (anterior cingulate/hippocampus), primarily involved in cognition/memory, rather than anxiety (N.S.)
gam(mean_fornix_volume ~ anxiety_dose + osex + s(PAT_AGE_AT_EXAM, k = 4, fx = F)+ total_volume, data=df_demo_and_fascicles_no_unclass_anxiety_dose)
To test whether this was specific to anxiety diagnosis and did not simply reflect general internalizing symptoms, I also evaluated mean uncinate volume in patients with MS+Depression (199) or MS+noDep (99) in this cohort (N.S.)
gam(mean_UF_vol ~ depDiagnosis + osex + s(PAT_AGE_AT_EXAM, k=4, fx=F)+ total_volume, data = df_dep)
I also evaluated whether lesion volume was associated with anxiety diagnosis, severity, and depression, and all were significant, suggesting that total lesion volume is associated with general psychopathology.
gam(volume_of_mimosa_lesions ~ (depDiagnosis|Diagnosis|anxiety_dose) + osex + s(PAT_AGE_AT_EXAM, k=4, fx=F)+ total_volume, data=(df_dep|uncinate_by_dx_df|df_demo_and_fascicles_no_unclass_anxiety_dose))